
Page 4 - Fiduciary Oversight | First Actuarial
P. 4
Fiduciary product testing and analysis
Our evaluation work is
is
is
supported by detailed portfolio analysis
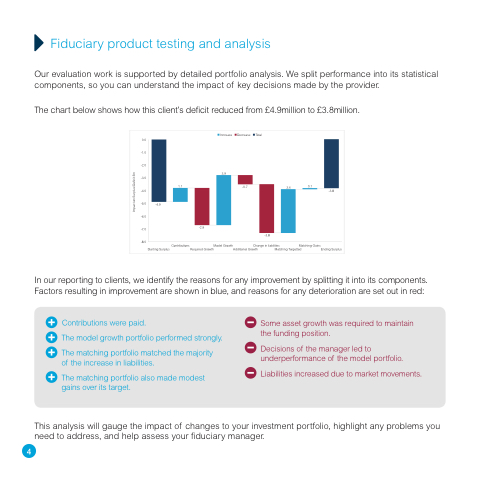
We split performance into its statistical components so you can understand the the impact of key decisions made by the the provider The chart below shows how how this client’s deficit reduced from £4 9million to £3 8million Increase
3 9 Decrease
-0 7
Total
0 0 0 0 -1 0 -2 0 -3 0 -4 0 -5 0 -4 9 -6 0 -7 0 -8 0 1 1 1 1 Contributions
3 4 0 1 Matching Gains
-3 8 Ending Surplus
Starting Surplus
Model Growth Required Growth Change in liabilities
Additional Growth Matching Targetted
-2 9 -3 8 In our reporting to to clients we identify the reasons for any improvement by splitting it it it into its components Factors resulting in in in in improvement are are shown in in in in blue and reasons for any deterioration are are set out in in in in red:
Contributions
were paid The model growth portfolio performed strongly The matching portfolio matched the majority of the increase in in liabilities
The matching portfolio also made modest gains over its target Some asset growth was required to maintain the funding position Decisions of the manager led to underperformance of the model portfolio Liabilities increased due to market movements This analysis
will gauge the impact of changes to your investment portfolio highlight any problems you you need to address and help assess your fiduciary manager 45
Impact on Surplus/Deficit £m
